Dashboard Overview
The web dashboard is a read-only, live browser view over your local Gitmoot
store. It renders the same state the gitmoot dashboard TUI shows — runs, jobs,
agents, locks, daemon health — but as an orchestration graph you can watch update
in real time, with click-through to each job's prompt and output.
It is strictly read-only: it never mutates workflow state, never touches the daemon path, and exposes no action controls. To act on a job (retry, cancel, answer a prompt) use the CLI or the interactive TUI — see the CLI Reference.
Launching it
gitmoot dashboard --web                       # serve on 127.0.0.1:8080
gitmoot dashboard --web --addr 127.0.0.1:9000 # pick another localhost port
--web starts a foreground HTTP server and blocks until interrupted (Ctrl-C).
On start it prints the bound address:
gitmoot dashboard serving read-only at http://127.0.0.1:8080 (Ctrl-C to stop)
--addrsets the listen address. The default is127.0.0.1:8080(localhost only).- The server is separate from the daemon — it reads the store directly, so it works whether or not the daemon is running (a stopped daemon simply shows as stopped on the Health page).
--webis one mode ofgitmoot dashboard; without it the command runs the interactive TUI or a one-shot snapshot instead. See thedashboardcommand for the full flag set.
Routes
The UI is a single-page app with client-side routing (the browser URL updates as you navigate, so every view is linkable and reloadable):
| Route | View |
|---|---|
/ | Graph — the delegation DAG of the most-recent active run |
/?run=<id> | Graph scoped to a specific run |
/galaxy | Galaxy — the whole-history force graph |
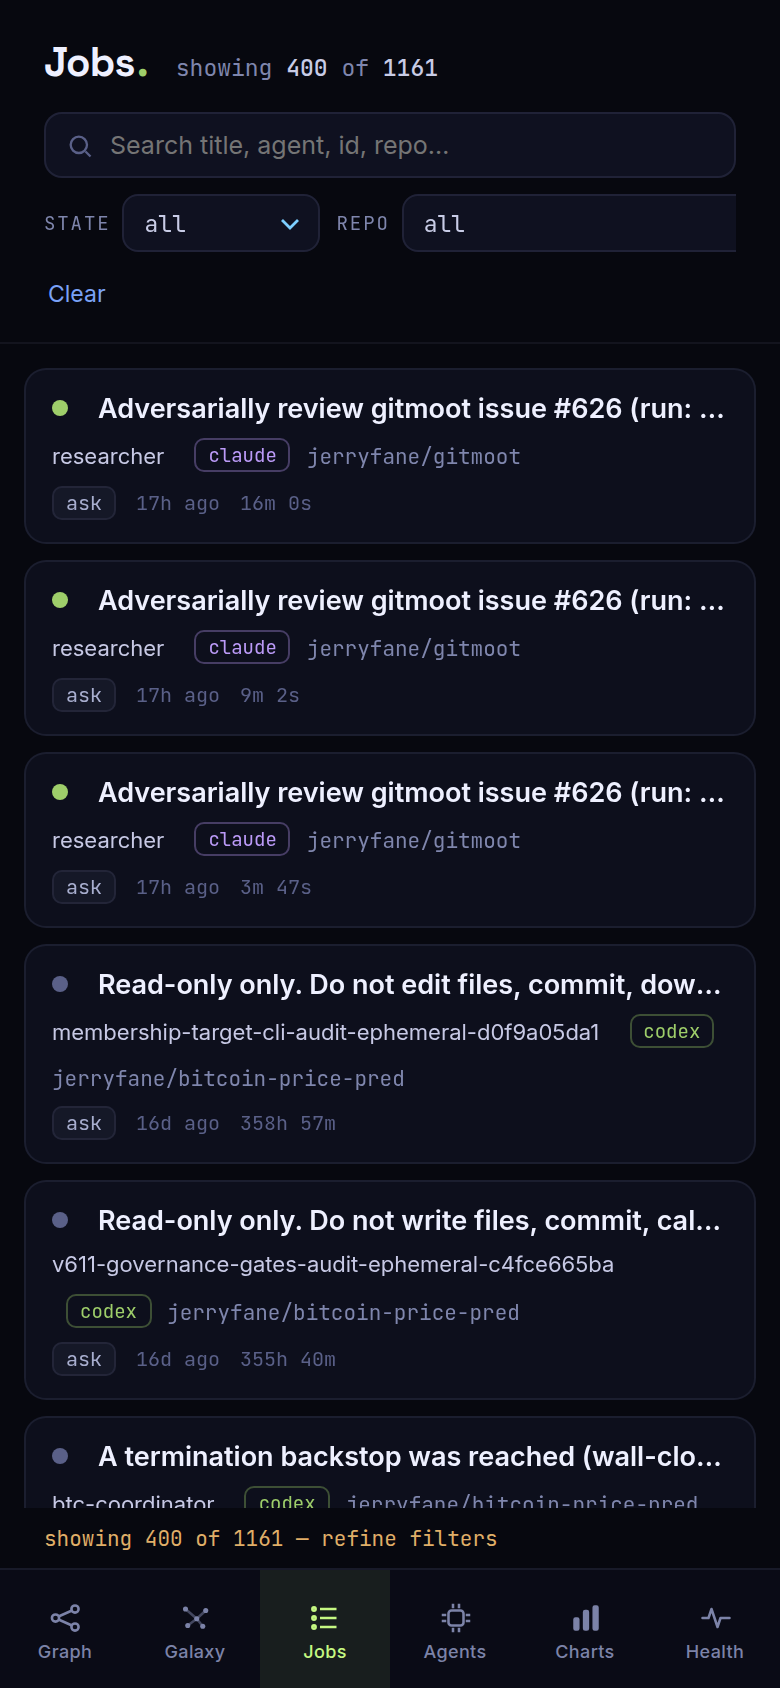
/jobs | Jobs — every job across every run |
/jobs?agent=<name> | Jobs pre-filtered to one agent |
/agents | Agents — one card per registered agent |
/agents/<name> | Agent detail (template, prompt, version history) |
/charts | Charts — activity time series |
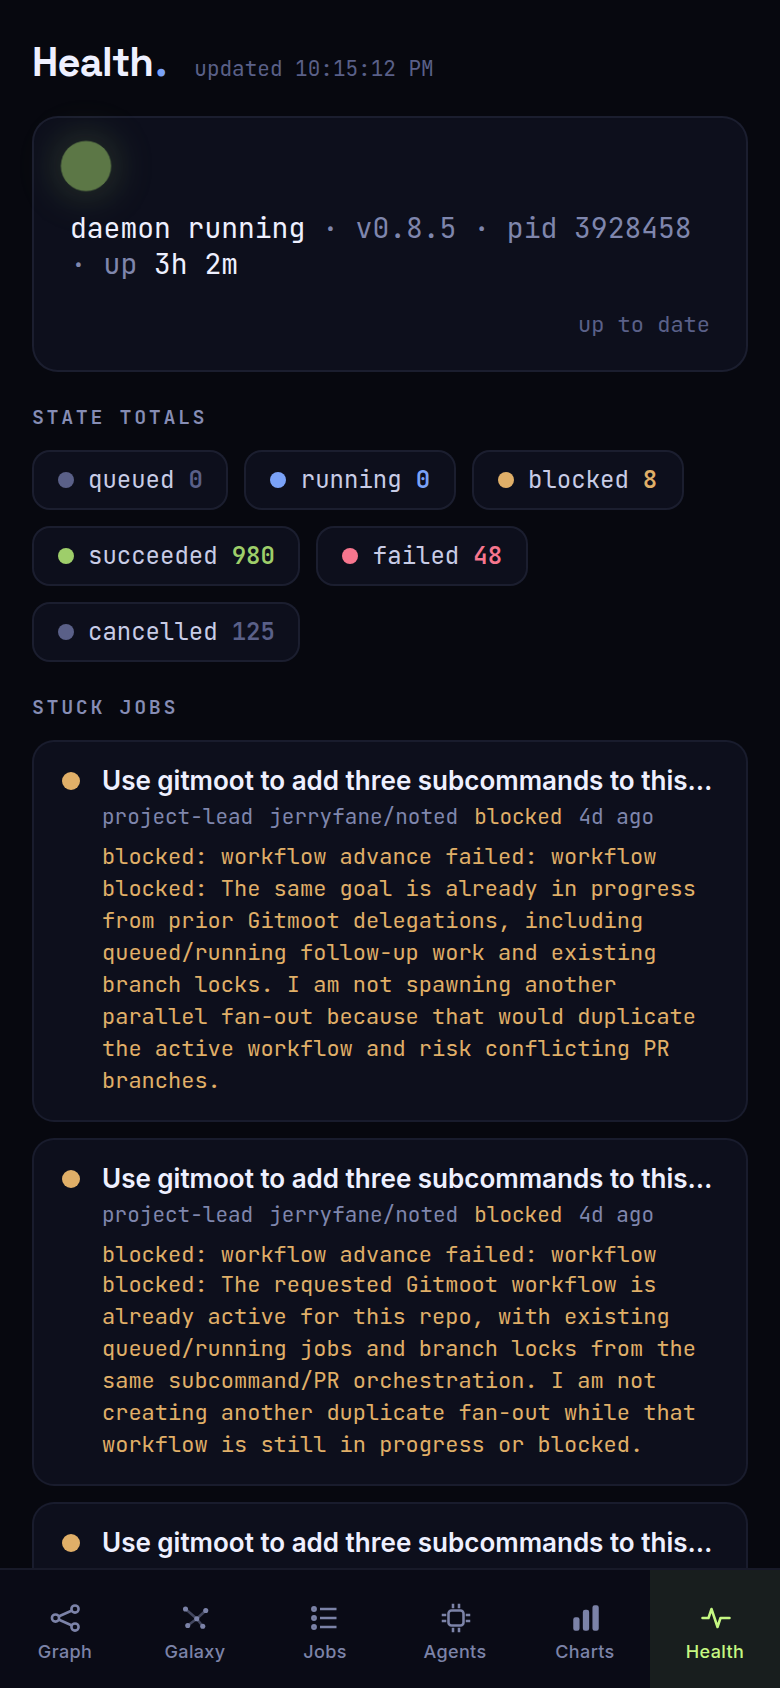
/health | Health — daemon status, totals, stuck jobs, locks, failures |
/attention | Needs a human — blocked gates, pending approvals, candidates |
Unknown paths normalize back to /. Each view is backed by a small read-only
JSON API (/api/runs, /api/jobs, /api/agents, /api/agent/{name},
/api/charts, /api/health, /api/attention, /api/job/{id}/checks,
/api/run/{id}/verdicts, /api/state, /api/job/{id}, /api/graph) plus a
Server-Sent Events stream at /events.
See Dashboard Views for what each view shows.
Auto-refresh
The dashboard stays live without a manual reload:
- Graph — the runs column reloads every 15s; the selected run's graph
streams over SSE (
/events?run=<id>), so nodes change state as the orchestra runs (running nodes pulse). - Galaxy, Jobs, Agents, Charts, Health — each polls its data every 12s while it is the active view (background views do not poll).
- Health additionally re-renders its relative-time cells every second, so "stuck for N minutes" and daemon uptime tick live between polls.
Mobile
The UI is responsive at a 768px breakpoint (also treating coarse-pointer devices as touch). On a phone the 216px left nav rail is replaced by a 60px bottom tab bar, detail panels (node, job, agent) open as full-screen sheets, the Jobs table collapses to cards, and the Graph runs column becomes a full-screen drawer reachable from a floating "Runs" tab. Desktop rendering is unchanged.
| Health (mobile) | Jobs (mobile) |
|---|---|
 |  |
Security
The dashboard serves private data: job prompts, agent outputs, template bodies, repo names and lock owners are all visible to anyone who can reach the port. There is no authentication built in.
By default --web binds to 127.0.0.1:8080, reachable only from the local
machine — keep it that way for normal use. If you must expose it beyond
localhost, do not bind it to a public interface directly. Bind it to an
internal address and put an authenticating layer in front of it — a reverse
proxy that enforces auth, or a zero-trust access proxy (e.g. an identity-aware
proxy or a private tunnel). The dashboard trusts every request it receives.